CERES : Software to automatically analyze the cerebellum in brain MRI to provide a report including volume information on different aspects of the cerebellum
Domain Health and wellbeing
Technologies
Imaging Technologies for Health
Digital exploitation of health data
Challenges
Software providing researchers and practitioners with automated quantitative analysis of cerebellum MRI data. CERES is able to provide expected volume and thickness for each considered structures according to age and sex of the subject under study. It could help to detect volumetric abnormality and thus potential pathology (multiple sclerosis, Alzheimer’s disease, schizophrenia…).
Innovative solution
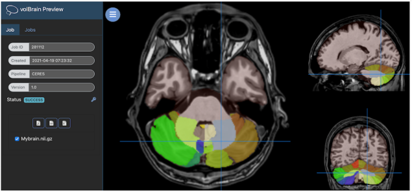
CERES is a pipeline to automatically analyze cerebellum in brain MRI. It gets an anonymized T1w MRI brain volume in NIFTI format and produces a pdf report with the volumes of the main cerebellum tissues (WM and GM) and the cerebellum lobules.
APPLICATIONS
-
Clinical trials
-
Companion diagnostics
-
Clinical routine
COMPETITIVES ADVANTAGES
-
No need of learning complex software packages
-
No need having expensive computational infrastructures in your local site
-
Faster and more accurate than other solutions
-
CERES works in a fully automatic manner and is able to provide brain structure volumes without any human interaction
-
Two reports (CSV and PDF) providing all the volumetry values calculated from the segmentations as well as asymmetry indexes
DEVELOPMENT STATUS:
-
CERES already processed more than 63000 MRI through volBrain platform.
How it works
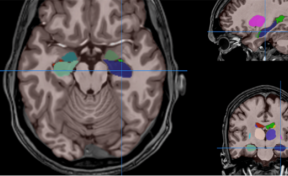
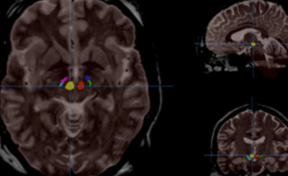
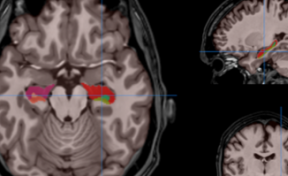
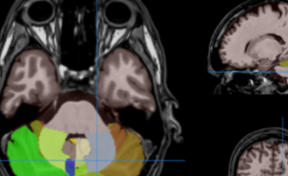
Cerebellum white matter and lobules were manually segmented by experts in a set of T1w MRI. This training library is then used to perform automatic segmentation of your new cases. All structures were outlined according to the definition described in Park et al., 2014 « Derivation of high-resolution MRI atlases of the human cerebellum at 3 T and segmentation using multiple automatically generated templates. » (NeuroImage 95: 217 - 231, 2014).
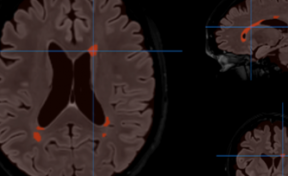
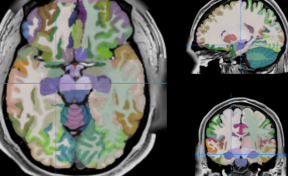
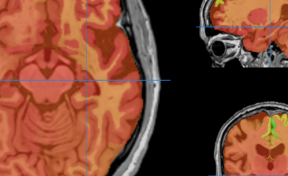
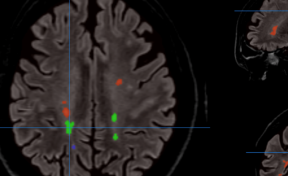
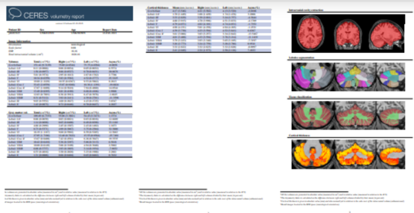
Once the process is finished, you will be notified by e-mail so you will be able to download a package including some image files and two (CSV and PDF) reports providing all the volumetry values calculated from the segmentations. As you can see in the figure below, the PDF includes patient information, the volumes of parenchyma, brain tissues, macrostructures and subcortical structures as well as asymmetry indexes. Finally, it also includes several snapshots from the different labeling steps as a quality control.
Inventors
Developed by Pierrick COUPÉ (LaBRI - université de Bordeaux, CNRS, Bordeaux INP) & Jose Vicente MANJON HERRERA (Universitat Politècnica de València)
IP
Software registered with the Program Protection Agency APP
PARTERSHIPS
License to companies providing :
- Global healthcare solutions
- Diagnostic medical imaging solutions
- Medical imaging equipment
Contact
Jean-Luc CHAGNAUD
%6a%6c%2e%63%68%61%67%6e%61%75%64%40%61%73%74%2d%69%6e%6e%6f%76%61%74%69%6f%6e%73%2e%63%6f%6d
Associated innovations
- VolBrain A software to analyze MRI brain data. It provides a report including volume information on brain structures.
- pBrain : A software providing Parkinson’s disease related deep nucleus segmentation (Substantia Nigra locus niger), Red Nucleus and Subthalamic nucleus) using T2w MR images.
- HIPS : A software providing hippocampus subfield segmentation based on two different delineation protocols using both monomodal (T1w) and multimodal (T1w and T2w) MR images.
- LesionBrain : A software providing IC extraction, brain tissue classification and delineation/ classification of white matter hyperintense lesions using T1w and FLAIR MR images.
- AssemblyNet : A software providing segmentation of the intracranial cavity, brain tissues (WM, subcortical GM, cortical GM, CSF), cortical lobes, cortical and subcortical structures using a T1w MR image.
More…
CERES is available on : www.volbrain.net